
Full sample estimates
This document provides supplementary information for the main analysis of airborne-fraction trends using multiple LULC measurement combinations. We replicate the OLS and WLS trend analysis for the full sample (1959-2024) and for the sample ending in 2023, and we also report intercept estimates for completeness. The main finding is that incorporating denominator-measurement information via WLS substantially changes inference relative to OLS benchmarks, providing robust evidence of a positive AF trend that is not driven by the 2024 jump.
In the full sample, all approaches produce a positive slope, and both WLS specifications provide much stronger evidence than OLS (HAC p-values 0.00004 and 0.00050 versus 0.01112 and 0.06846). The estimated WLS trend is also steeper (0.00265 and 0.00230 per year versus 0.00158 and 0.00117), consistent with greater weight on years with lower denominator uncertainty. The WLS slope implies an increase of about +0.17 and +0.15 in AF over 1959-2024, compared with about +0.10 and +0.08 from the two OLS specifications. The R-squared is also higher for WLS, indicating a better fit when accounting for measurement uncertainty. Nevertheless, the R-squared values are small in absolute terms, signalling that AF is noisy and that the trend is only one component of its variation.
@tbl-trend-full reports full-sample trend estimates for the four specifications: OLS using GCB LULC, OLS using the all-LULC mean, WLS using the GCB denominator with all-LULC weights, and WLS using the all-LULC denominator with all-LULC weights.
| Trend, full sample | OLS (GCB) | OLS (all) | WLS (GCB) | WLS (all) |
|---|---|---|---|---|
| Estimate | 0.00158 | 0.00117 | 0.00265 | 0.00230 |
| Standard error | 0.00077 | 0.00079 | 0.00002 | 0.00002 |
| HAC standard error | 0.00062 | 0.00064 | 0.00065 | 0.00066 |
| p-value | 0.04021 | 0.13891 | 0.00000 | 0.00000 |
| HAC p-value | 0.01112 | 0.06846 | 0.00004 | 0.00050 |
| R-squared | 0.06171 | 0.03309 | 0.14899 | 0.11107 |
@fig-primary-delta-gls shows the AF series using the mean of all LULC measurements together with the associated variance, the OLS trend, and the delta-method WLS trend when using the full sample. The gray bars show the relative weights (standardised so that the maximum weight is 1) assigned to each year in the WLS estimation, which are inversely proportional to the estimated variance of the AF estimate for that year.
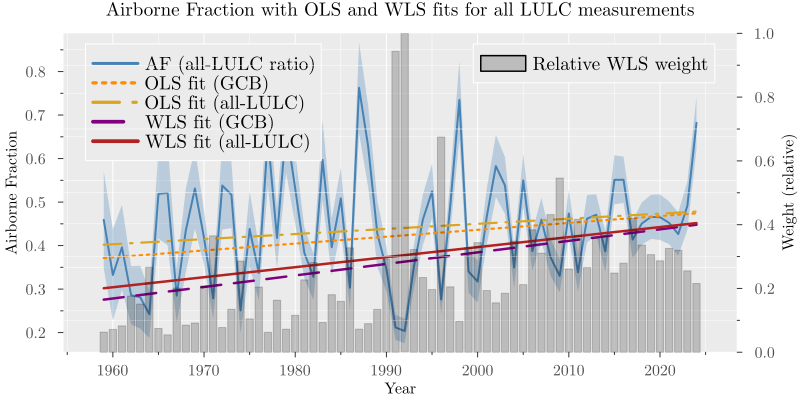
The WLS trends are steeper than the OLS trends, which is consistent with the numerical results in @tbl-trend-full. The WLS specifications assign more weight to years with lower estimated denominator-related uncertainty (for example, much of 2000-2020) and less weight to noisier years (for example, much of the 1960s-1970s), which helps reveal the positive trend signal in the data.
Endpoint robustness
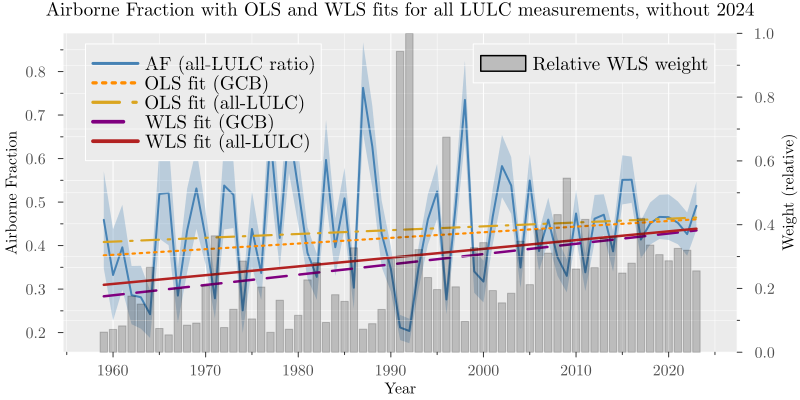
The final observation (2024) shows a large increase in AF. To ensure this point is not mechanically driving the result, we re-estimate the same four specifications on the subsample ending in 2023. Results are shown in @tbl-trend-2023 and @fig-endpoint-robustness.
| Trend (up to 2023) | OLS (GCB) | OLS (all) | WLS (GCB) | WLS (all) |
|---|---|---|---|---|
| Estimate | 0.00130 | 0.00088 | 0.00237 | 0.00202 |
| Standard error | 0.00078 | 0.00080 | 0.00002 | 0.00002 |
| HAC standard error | 0.00058 | 0.00060 | 0.00059 | 0.00060 |
| p-value | 0.09516 | 0.27109 | 0.00000 | 0.00000 |
| HAC p-value | 0.02495 | 0.14322 | 0.00005 | 0.00080 |
| R-squared | 0.04233 | 0.01886 | 0.12552 | 0.08930 |
Results remain qualitatively unchanged for the WLS specifications: both estimated slopes stay positive and statistically significant (0.00237 with HAC p-value = 0.00005, and 0.00202 with HAC p-value = 0.00080). For the sample ending in 2023, OLS using GCB LULC is positive but only marginally significant under conventional inference (p-value = 0.09516), while OLS using the all-LULC mean is not significant (p-value = 0.27109). Overall, the WLS results are robust to endpoint exclusion, whereas OLS results are more sensitive to denominator construction and provide weaker evidence of a positive trend.
Supplementary numerical results
While the main focus is on the slope estimates, we also report intercept estimates for completeness. Results for the intercept estimates are shown in @tbl-intercept-comparison.
| Intercept | OLS (GCB) full | OLS (all) full | WLS (GCB) full | WLS (all) full | OLS (GCB) 2023 | OLS (all) 2023 | WLS (GCB) 2023 | WLS (all) 2023 |
|---|---|---|---|---|---|---|---|---|
| Estimate | 0.37141 | 0.40194 | 0.27573 | 0.30194 | 0.3775 | 0.40821 | 0.2834 | 0.30982 |
| Standard error | 0.02904 | 0.02984 | 0.00092 | 0.00095 | 0.02881 | 0.0296 | 0.00091 | 0.00093 |
| HAC standard error | 0.02729 | 0.02827 | 0.03775 | 0.03896 | 0.02688 | 0.02794 | 0.03635 | 0.03754 |
| p-value | 0.0000 | 0.0000 | 0.0000 | 0.0000 | 0.0000 | 0.0000 | 0.0000 | 0.0000 |
| HAC p-value | 0.0000 | 0.0000 | 0.0000 | 0.0000 | 0.0000 | 0.0000 | 0.0000 | 0.0000 |
| R-squared | 0.06171 | 0.03309 | 0.14899 | 0.11107 | 0.04233 | 0.01886 | 0.12552 | 0.0893 |