Do’s and don’ts of statistics in research
Writing and Reviewing Research Papers
Department of Mathematical Sciences, Aalborg University
Statistics in research
Statistics in research
Introduction
Statistics is a branch of mathematics that deals with the collection, analysis, interpretation, and presentation of data.
Data is sampled from a population and used to make inferences about the population.
It is a fundamental tool in research.
Statistics in research
Statistics is used to summarize data.
It is used to make inferences about populations.
It is used to make informed decisions
It is used to test hypotheses.
- It is conventionally divided into descriptive and inferential statistics.
(Descriptive) Statistics
(Descriptive) Statistics
Descriptive statistics is used to summarize data.
It is used to describe the main features of a dataset.
It is used to present data in a meaningful way.
It is used to identify patterns in data.
(Descriptive) Statistics
Measures of central tendency
Mean: Average value of a dataset.
Median: Middle value of a dataset.
Mode: Most frequent value in a dataset.
- It is important to choose the right measure of central tendency depending on the data.
Measures of central tendency
Don’t use the mean to report about the median.
Do use the median when the data is skewed or has outliers.
Do label the axes in your plots.
Measures of central tendency
Categorical data: Elementary, Secondary, Higher Education
Don’t use the mean when you have categorical data.
Do use the mode or median instead.
(Descriptive) Statistics
Measures of dispersion
Range: Difference between the maximum and minimum values.
Interquartile range: Difference between the 75th and 25th percentiles.
Variance: Average of the squared differences from the mean.
Standard deviation: Square root of the variance.
Measures of dispersion
"Range: 2, Interquartile range: 1.0, Variance: 0.5289855072463768"- Variance is not meaningful for categorical data.
Measures of dispersion
Do use standard deviation to preserve the units of the data.
Don’t use the variance when you have outliers.
Do use the right measure of dispersion depending on the data.
(Descriptive) Statistics
Data visualization
Scatter plot: Relationship between two variables.
Histogram: Distribution of a variable.
Box plot: Distribution of a variable, quartiles.
Density plot: Distribution of a variable, smoothed.
Scatter plot
Do think about the units of the variables.
Do summarize the data to make it easier to understand.
Box plot
Density plot
- Do think if the data is Normally distributed.
(Inferential) Statistics
(Inferential) Statistics
Inferential statistics is used to make inferences about populations.
It is used to test hypotheses.
It is used to make informed decisions.
It is used to estimate parameters.
(Inferential) Statistics
Hypothesis testing
Null and Alternative hypothesis
Types of error (Type I and Type II)
P-value
Confidence interval
Null and Alternative hypothesis
Null hypothesis: No effect or no difference.
Alternative hypothesis: Effect or difference.
Example:
Null hypothesis: The vaccine has no effect.
Alternative hypothesis: The vaccine has an effect.
Do state the null and alternative hypothesis.
Do make sure that the null hypothesis is the status quo.
Do make sure that the null and alternative hypothesis are mutually exclusive.
Types of error
Type I error: Rejecting the null hypothesis when it is true.
Type II error: Failing to reject the null hypothesis when it is false.
Example:
Type I error: Jail an innocent person.
Type II error: Free a guilty person.
P-value
The probability of observing the data given that the null hypothesis is true.
It is used to test hypotheses.
(For historical reasons) It is compared to a threshold, usually 0.05 or 0.01.
P-value
P-value
Do report the p-value.
Do state the p-value threshold before the test.
Do use the p-value to make informed decisions.
Don’t use the p-value to make binary decisions.
Don’t change the model to get a p-value below the threshold.
Confidence interval
A range of values that is likely to contain the true value of a parameter.
It is constructed from the data, hence we cannot guarantee that it contains the true value.
(For historical reasons) It is usually set at 95%.
Confidence interval
Confidence interval
Confidence interval

Confidence interval
Do and don’ts of statistics in research
Do and don’ts of statistics in research
Do use the right measure of central tendency.
Don’t use the mean when the data is skewed or has outliers.
Do use the right measure of dispersion.
Don’t use the variance when you have outliers.
Do use standard deviation to preserve the units of the data.
Do and don’ts of statistics in research
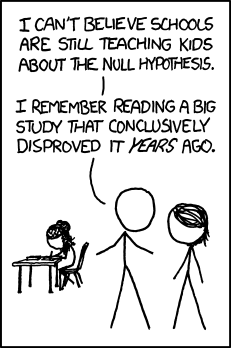
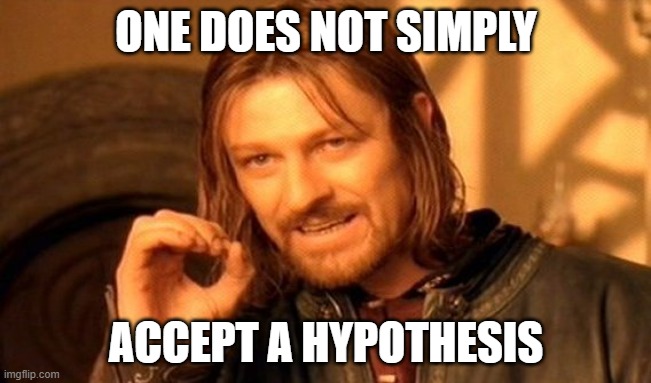
Do say the data supports the hypothesis.
Don’t confuse improbability with impossibility.
Biases in statistics
Selection bias: When the sample is not representative of the population.
Confirmation bias: When we look for evidence that confirms our beliefs.
Publication bias: When only significant results are published.
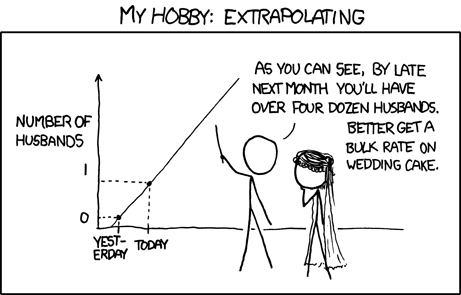
Extrapolation bias: When we extrapolate beyond the data.
Causation bias: When we confuse correlation with causation.
Conclusion
Conclusion
- Ask questions, use PhD consult: https://www.math.aau.dk/research/phd-consult
More questions? eduardo@math.aau.dk

Do and don’ts of statistics in research