Activating project at `~/Library/CloudStorage/OneDrive-AalborgUniversitet/Research/Webpage/everval.github.io/lectures` Installed LongMemory ───── v1.0.1 Installed FiniteDiff ───── v2.30.0 Installed ChainRulesCore ─ v1.26.1 Updating `~/Library/CloudStorage/OneDrive-AalborgUniversitet/Research/Webpage/everval.github.io/lectures/Project.toml` [336ed68f] + CSV v0.10.16 [a93c6f00] + DataFrames v1.8.2 [31c24e10] + Distributions v0.25.124 [f5f8e4a8] + LongMemory v1.0.1 [91a5bcdd] + Plots v1.41.6 [10745b16] + Statistics v1.11.1 [2913bbd2] + StatsBase v0.34.10 [f3b207a7] + StatsPlots v0.15.8 [9a3f8284] ~ Random ⇒ v1.11.0 Updating `~/Library/CloudStorage/OneDrive-AalborgUniversitet/Research/Webpage/everval.github.io/lectures/Manifest.toml` [47edcb42] + ADTypes v1.21.0 [621f4979] + AbstractFFTs v1.5.0 [1520ce14] + AbstractTrees v0.4.5 [79e6a3ab] + Adapt v4.5.2 [66dad0bd] + AliasTables v1.1.3 [7d9fca2a] + Arpack v0.5.4 [4fba245c] + ArrayInterface v7.24.0 [13072b0f] + AxisAlgorithms v1.1.0 [d1d4a3ce] + BitFlags v0.1.9 [336ed68f] + CSV v0.10.16 [d360d2e6] + ChainRulesCore v1.26.1 [aaaa29a8] + Clustering v0.15.8 [944b1d66] + CodecZlib v0.7.8 [35d6a980] + ColorSchemes v3.31.0 [3da002f7] + ColorTypes v0.12.1 [c3611d14] + ColorVectorSpace v0.11.0 [5ae59095] + Colors v0.13.1 [bbf7d656] + CommonSubexpressions v0.3.1 [34da2185] + Compat v4.18.1 [f0e56b4a] + ConcurrentUtilities v2.5.1 [187b0558] + ConstructionBase v1.6.0 [d38c429a] + Contour v0.6.3 [a8cc5b0e] + Crayons v4.1.1 [9a962f9c] + DataAPI v1.16.0 [a93c6f00] + DataFrames v1.8.2 [864edb3b] + DataStructures v0.19.4 [e2d170a0] + DataValueInterfaces v1.0.0 [8bb1440f] + DelimitedFiles v1.9.1 [163ba53b] + DiffResults v1.1.0 [b552c78f] + DiffRules v1.15.1 [a0c0ee7d] + DifferentiationInterface v0.7.16 [b4f34e82] + Distances v0.10.12 [31c24e10] + Distributions v0.25.124 [ffbed154] + DocStringExtensions v0.9.5 [4e289a0a] + EnumX v1.0.7 [460bff9d] + ExceptionUnwrapping v0.1.11 [c87230d0] + FFMPEG v0.4.5 [b86e33f2] + FFTA v0.3.1 [7a1cc6ca] + FFTW v1.10.0 [48062228] + FilePathsBase v0.9.24 [1a297f60] + FillArrays v1.16.0 [6a86dc24] + FiniteDiff v2.30.0 [53c48c17] + FixedPointNumbers v0.8.5 [1fa38f19] + Format v1.3.7 [f6369f11] + ForwardDiff v1.3.3 [28b8d3ca] + GR v0.73.24 [42e2da0e] + Grisu v1.0.2 [cd3eb016] + HTTP v1.11.0 [34004b35] + HypergeometricFunctions v0.3.28 [842dd82b] + InlineStrings v1.4.5 [18e54dd8] + IntegerMathUtils v0.1.3 [a98d9a8b] + Interpolations v0.16.2 [41ab1584] + InvertedIndices v1.3.1 [92d709cd] + IrrationalConstants v0.2.6 [82899510] + IteratorInterfaceExtensions v1.0.0 [1019f520] + JLFzf v0.1.11 [692b3bcd] + JLLWrappers v1.7.1 [682c06a0] + JSON v1.5.0 [5ab0869b] + KernelDensity v0.6.11 [b964fa9f] + LaTeXStrings v1.4.0 [23fbe1c1] + Latexify v0.16.10 ⌃ [d3d80556] + LineSearches v7.5.1 [2ab3a3ac] + LogExpFunctions v0.3.29 [e6f89c97] + LoggingExtras v1.2.0 [f5f8e4a8] + LongMemory v1.0.1 [1914dd2f] + MacroTools v0.5.16 [739be429] + MbedTLS v1.1.10 [442fdcdd] + Measures v0.3.3 [e1d29d7a] + Missings v1.2.0 [46d2c3a1] + MuladdMacro v0.2.4 [6f286f6a] + MultivariateStats v0.10.4 ⌅ [d41bc354] + NLSolversBase v7.10.0 [77ba4419] + NaNMath v1.1.3 [b8a86587] + NearestNeighbors v0.4.27 [510215fc] + Observables v0.5.5 [6fe1bfb0] + OffsetArrays v1.17.0 [4d8831e6] + OpenSSL v1.6.1 ⌅ [429524aa] + Optim v1.13.3 [bac558e1] + OrderedCollections v1.8.1 [90014a1f] + PDMats v0.11.37 [69de0a69] + Parsers v2.8.3 [ccf2f8ad] + PlotThemes v3.3.0 [995b91a9] + PlotUtils v1.4.4 [91a5bcdd] + Plots v1.41.6 [2dfb63ee] + PooledArrays v1.4.3 [85a6dd25] + PositiveFactorizations v0.2.4 [aea7be01] + PrecompileTools v1.3.3 [21216c6a] + Preferences v1.5.2 [08abe8d2] + PrettyTables v3.3.2 [27ebfcd6] + Primes v0.5.7 [43287f4e] + PtrArrays v1.4.0 [1fd47b50] + QuadGK v2.11.3 [c84ed2f1] + Ratios v0.4.5 [3cdcf5f2] + RecipesBase v1.3.4 [01d81517] + RecipesPipeline v0.6.12 [189a3867] + Reexport v1.2.2 [05181044] + RelocatableFolders v1.0.1 [ae029012] + Requires v1.3.1 [79098fc4] + Rmath v0.9.0 [6c6a2e73] + Scratch v1.3.0 [91c51154] + SentinelArrays v1.4.9 [efcf1570] + Setfield v1.1.2 [992d4aef] + Showoff v1.0.3 [777ac1f9] + SimpleBufferStream v1.2.0 [a2af1166] + SortingAlgorithms v1.2.2 [276daf66] + SpecialFunctions v2.7.2 [860ef19b] + StableRNGs v1.0.4 [90137ffa] + StaticArrays v1.9.18 [1e83bf80] + StaticArraysCore v1.4.4 [10745b16] + Statistics v1.11.1 [82ae8749] + StatsAPI v1.8.0 [2913bbd2] + StatsBase v0.34.10 [4c63d2b9] + StatsFuns v1.5.2 [f3b207a7] + StatsPlots v0.15.8 [892a3eda] + StringManipulation v0.4.4 [ec057cc2] + StructUtils v2.7.2 [ab02a1b2] + TableOperations v1.2.0 [3783bdb8] + TableTraits v1.0.1 [bd369af6] + Tables v1.12.1 [62fd8b95] + TensorCore v0.1.1 [3bb67fe8] + TranscodingStreams v0.11.3 [5c2747f8] + URIs v1.6.1 [1cfade01] + UnicodeFun v0.4.1 [41fe7b60] + Unzip v0.2.0 [ea10d353] + WeakRefStrings v1.4.2 [cc8bc4a8] + Widgets v0.6.7 [efce3f68] + WoodburyMatrices v1.1.0 [76eceee3] + WorkerUtilities v1.6.1 ⌅ [68821587] + Arpack_jll v3.5.2+0 [6e34b625] + Bzip2_jll v1.0.9+0 [83423d85] + Cairo_jll v1.18.6+0 [ee1fde0b] + Dbus_jll v1.16.2+0 [2702e6a9] + EpollShim_jll v0.0.20230411+1 [2e619515] + Expat_jll v2.7.3+0 [b22a6f82] + FFMPEG_jll v8.0.1+1 [f5851436] + FFTW_jll v3.3.11+0 [a3f928ae] + Fontconfig_jll v2.17.1+0 [d7e528f0] + FreeType2_jll v2.14.3+1 [559328eb] + FriBidi_jll v1.0.17+0 [0656b61e] + GLFW_jll v3.4.1+1 [d2c73de3] + GR_jll v0.73.24+0 ⌅ [b0724c58] + GettextRuntime_jll v0.22.4+0 [61579ee1] + Ghostscript_jll v9.55.1+0 [7746bdde] + Glib_jll v2.86.3+0 [3b182d85] + Graphite2_jll v1.3.15+0 [2e76f6c2] + HarfBuzz_jll v8.5.1+0 [1d5cc7b8] + IntelOpenMP_jll v2025.2.0+0 [aacddb02] + JpegTurbo_jll v3.1.5+0 [c1c5ebd0] + LAME_jll v3.100.3+0 [88015f11] + LERC_jll v4.1.0+0 [1d63c593] + LLVMOpenMP_jll v18.1.8+0 ⌅ [e9f186c6] + Libffi_jll v3.4.7+0 [7e76a0d4] + Libglvnd_jll v1.7.1+1 [94ce4f54] + Libiconv_jll v1.18.0+0 [4b2f31a3] + Libmount_jll v2.42.0+0 [89763e89] + Libtiff_jll v4.7.2+0 [38a345b3] + Libuuid_jll v2.42.0+0 [856f044c] + MKL_jll v2025.2.0+0 [c8ffd9c3] + MbedTLS_jll v2.28.1010+0 [e7412a2a] + Ogg_jll v1.3.6+0 [efe28fd5] + OpenSpecFun_jll v0.5.6+0 [91d4177d] + Opus_jll v1.6.1+0 [36c8627f] + Pango_jll v1.57.1+0 ⌅ [30392449] + Pixman_jll v0.44.2+0 [c0090381] + Qt6Base_jll v6.10.2+1 [629bc702] + Qt6Declarative_jll v6.10.2+1 [ce943373] + Qt6ShaderTools_jll v6.10.2+1 [6de9746b] + Qt6Svg_jll v6.10.2+0 [e99dba38] + Qt6Wayland_jll v6.10.2+1 [f50d1b31] + Rmath_jll v0.5.1+0 [a44049a8] + Vulkan_Loader_jll v1.3.243+0 [a2964d1f] + Wayland_jll v1.24.0+0 [ffd25f8a] + XZ_jll v5.8.3+0 [f67eecfb] + Xorg_libICE_jll v1.1.2+0 [c834827a] + Xorg_libSM_jll v1.2.6+0 [4f6342f7] + Xorg_libX11_jll v1.8.13+0 [0c0b7dd1] + Xorg_libXau_jll v1.0.13+0 [935fb764] + Xorg_libXcursor_jll v1.2.4+0 [a3789734] + Xorg_libXdmcp_jll v1.1.6+0 [1082639a] + Xorg_libXext_jll v1.3.8+0 [d091e8ba] + Xorg_libXfixes_jll v6.0.2+0 [a51aa0fd] + Xorg_libXi_jll v1.8.3+0 [d1454406] + Xorg_libXinerama_jll v1.1.7+0 [ec84b674] + Xorg_libXrandr_jll v1.5.6+0 [ea2f1a96] + Xorg_libXrender_jll v0.9.12+0 [a65dc6b1] + Xorg_libpciaccess_jll v0.18.1+0 [c7cfdc94] + Xorg_libxcb_jll v1.17.1+0 [cc61e674] + Xorg_libxkbfile_jll v1.2.0+0 [e920d4aa] + Xorg_xcb_util_cursor_jll v0.1.6+0 [12413925] + Xorg_xcb_util_image_jll v0.4.1+0 [2def613f] + Xorg_xcb_util_jll v0.4.1+0 [975044d2] + Xorg_xcb_util_keysyms_jll v0.4.1+0 [0d47668e] + Xorg_xcb_util_renderutil_jll v0.3.10+0 [c22f9ab0] + Xorg_xcb_util_wm_jll v0.4.2+0 [35661453] + Xorg_xkbcomp_jll v1.4.7+0 [33bec58e] + Xorg_xkeyboard_config_jll v2.44.0+0 [c5fb5394] + Xorg_xtrans_jll v1.6.0+0 [3161d3a3] + Zstd_jll v1.5.7+1 [35ca27e7] + eudev_jll v3.2.14+0 [214eeab7] + fzf_jll v0.61.1+0 [a4ae2306] + libaom_jll v3.13.3+0 [0ac62f75] + libass_jll v0.17.4+0 [1183f4f0] + libdecor_jll v0.2.2+0 [8e53e030] + libdrm_jll v2.4.125+1 [2db6ffa8] + libevdev_jll v1.13.4+0 [f638f0a6] + libfdk_aac_jll v2.0.4+0 [36db933b] + libinput_jll v1.28.1+0 [b53b4c65] + libpng_jll v1.6.58+0 [9a156e7d] + libva_jll v2.23.0+0 [f27f6e37] + libvorbis_jll v1.3.8+0 [009596ad] + mtdev_jll v1.1.7+0 [1317d2d5] + oneTBB_jll v2022.0.0+1 ⌅ [1270edf5] + x264_jll v10164.0.1+0 [dfaa095f] + x265_jll v4.1.0+0 [d8fb68d0] + xkbcommon_jll v1.13.0+0 [0dad84c5] + ArgTools v1.1.2 [56f22d72] + Artifacts v1.11.0 [2a0f44e3] + Base64 v1.11.0 [ade2ca70] + Dates v1.11.0 [8ba89e20] + Distributed v1.11.0 [f43a241f] + Downloads v1.7.0 [7b1f6079] + FileWatching v1.11.0 [9fa8497b] + Future v1.11.0 [b77e0a4c] + InteractiveUtils v1.11.0 [ac6e5ff7] + JuliaSyntaxHighlighting v1.12.0 [4af54fe1] + LazyArtifacts v1.11.0 [b27032c2] + LibCURL v0.6.4 [76f85450] + LibGit2 v1.11.0 [8f399da3] + Libdl v1.11.0 [37e2e46d] + LinearAlgebra v1.12.0 [56ddb016] + Logging v1.11.0 [d6f4376e] + Markdown v1.11.0 [a63ad114] + Mmap v1.11.0 [ca575930] + NetworkOptions v1.3.0 [44cfe95a] + Pkg v1.12.1 [de0858da] + Printf v1.11.0 [3fa0cd96] + REPL v1.11.0 [9a3f8284] ~ Random ⇒ v1.11.0 [ea8e919c] + SHA v0.7.0 [9e88b42a] + Serialization v1.11.0 [1a1011a3] + SharedArrays v1.11.0 [6462fe0b] + Sockets v1.11.0 [2f01184e] + SparseArrays v1.12.0 [f489334b] + StyledStrings v1.11.0 [4607b0f0] + SuiteSparse [fa267f1f] + TOML v1.0.3 [a4e569a6] + Tar v1.10.0 [8dfed614] + Test v1.11.0 [cf7118a7] + UUIDs v1.11.0 [4ec0a83e] + Unicode v1.11.0 [e66e0078] + CompilerSupportLibraries_jll v1.3.0+1 [deac9b47] + LibCURL_jll v8.15.0+0 [e37daf67] + LibGit2_jll v1.9.0+0 [29816b5a] + LibSSH2_jll v1.11.3+1 [14a3606d] + MozillaCACerts_jll v2025.11.4 [4536629a] + OpenBLAS_jll v0.3.29+0 [05823500] + OpenLibm_jll v0.8.7+0 [458c3c95] + OpenSSL_jll v3.5.4+0 [efcefdf7] + PCRE2_jll v10.44.0+1 [bea87d4a] + SuiteSparse_jll v7.8.3+2 [83775a58] + Zlib_jll v1.3.1+2 [8e850b90] + libblastrampoline_jll v5.15.0+0 [8e850ede] + nghttp2_jll v1.64.0+1 [3f19e933] + p7zip_jll v17.7.0+0 Info Packages marked with ⌃ and ⌅ have new versions available. Those with ⌃ may be upgradable, but those with ⌅ are restricted by compatibility constraints from upgrading. To see why use `status --outdated -m`
Do’s and don’ts of statistics in research
Writing and Reviewing Research Papers
Department of Mathematical Sciences, Aalborg University
Statistics in research
Statistics in research
Introduction
Statistics is a branch of mathematics that deals with the collection, analysis, interpretation, and presentation of data.
Data is sampled from a population and used to make inferences about the population.
It is a fundamental tool in research.
Statistics in research
Statistics is used to summarize data.
It is used to make inferences about populations.
It is used to make informed decisions
It is used to test hypotheses.
- It is conventionally divided into descriptive and inferential statistics.
(Descriptive) Statistics
(Descriptive) Statistics
Descriptive statistics is used to summarize data.
It is used to describe the main features of a dataset.
It is used to present data in a meaningful way.
It is used to identify patterns in data.
(Descriptive) Statistics
Measures of central tendency
Mean: Average value of a dataset.
Median: Middle value of a dataset.
Mode: Most frequent value in a dataset.
- It is important to choose the right measure of central tendency depending on the data.
Measures of central tendency
Precompiling packages... 629.8 ms ✓ OffsetArrays → OffsetArraysAdaptExt 411.1 ms ✓ Adapt → AdaptStaticArraysExt 898.7 ms ✓ MultivariateStats 1052.6 ms ✓ ChainRulesCore 563.0 ms ✓ Distances → DistancesChainRulesCoreExt 564.6 ms ✓ AbstractFFTs → AbstractFFTsChainRulesCoreExt 793.3 ms ✓ StaticArrays → StaticArraysChainRulesCoreExt 808.6 ms ✓ ChainRulesCore → ChainRulesCoreSparseArraysExt 935.8 ms ✓ LogExpFunctions → LogExpFunctionsChainRulesCoreExt 929.7 ms ✓ StatsFuns → StatsFunsChainRulesCoreExt 1030.1 ms ✓ SpecialFunctions → SpecialFunctionsChainRulesCoreExt 1083.2 ms ✓ Distributions → DistributionsChainRulesCoreExt 2345.1 ms ✓ Interpolations 2079.7 ms ✓ KernelDensity 3143.9 ms ✓ StatsPlots 15 dependencies successfully precompiled in 10 seconds. 235 already precompiled.

Don’t use the mean to report about the median.
Do use the median when the data is skewed or has outliers.
Do label the axes in your plots.
Measures of central tendency
Categorical data: Elementary, Secondary, Higher Education

Don’t use the mean when you have categorical data.
Do use the mode or median instead.
(Descriptive) Statistics
Measures of dispersion
Range: Difference between the maximum and minimum values.
Interquartile range: Difference between the 75th and 25th percentiles.
Variance: Average of the squared differences from the mean.
Standard deviation: Square root of the variance.
Measures of dispersion
"Range: 2, Interquartile range: 1.0, Variance: 0.5289855072463768"- Variance is not meaningful for categorical data.
Measures of dispersion
Do use standard deviation to preserve the units of the data.
Don’t use the variance when you have outliers.
Do use the right measure of dispersion depending on the data.
(Descriptive) Statistics
Data visualization
Scatter plot: Relationship between two variables.
Histogram: Distribution of a variable.
Box plot: Distribution of a variable, quartiles.
Density plot: Distribution of a variable, smoothed.
Scatter plot

Do think about the units of the variables.
Do summarize the data to make it easier to understand.
Box plot


Density plot


- Do think if the data is Normally distributed.
(Inferential) Statistics
(Inferential) Statistics
Inferential statistics is used to make inferences about populations.
It is used to test hypotheses.
It is used to make informed decisions.
It is used to estimate parameters.
(Inferential) Statistics
Hypothesis testing
Null and Alternative hypothesis
Types of error (Type I and Type II)
P-value
Confidence interval
Null and Alternative hypothesis
Null hypothesis: No effect or no difference.
Alternative hypothesis: Effect or difference.
Example:
Null hypothesis: The vaccine has no effect.
Alternative hypothesis: The vaccine has an effect.
Do state the null and alternative hypothesis.
Do make sure that the null hypothesis is the status quo.
Do make sure that the null and alternative hypothesis are mutually exclusive.
Types of error
Type I error: Rejecting the null hypothesis when it is true.
Type II error: Failing to reject the null hypothesis when it is false.
Example:
Type I error: Jail an innocent person.
Type II error: Free a guilty person.
P-value
The probability of observing the data given that the null hypothesis is true.
It is used to test hypotheses.
(For historical reasons) It is compared to a threshold, usually 0.05 or 0.01.
P-value

P-value
Do report the p-value.
Do state the p-value threshold before the test.
Do use the p-value to make informed decisions.
Don’t use the p-value to make binary decisions.
Don’t change the model to get a p-value below the threshold.
Confidence interval
A range of values that is likely to contain the true value of a parameter.
It is constructed from the data, hence we cannot guarantee that it contains the true value.
(For historical reasons) It is usually set at 95%.
Confidence interval

Confidence interval

Confidence interval
[ Info: Saved animation to /Users/eduardo/Library/CloudStorage/OneDrive-AalborgUniversitet/Research/Webpage/everval.github.io/lectures/regression.gif

Confidence interval

Do and don’ts of statistics in research
Do and don’ts of statistics in research
Do use the right measure of central tendency.
Don’t use the mean when the data is skewed or has outliers.
Do use the right measure of dispersion.
Don’t use the variance when you have outliers.
Do use standard deviation to preserve the units of the data.
Do and don’ts of statistics in research
Do say the data supports the hypothesis.
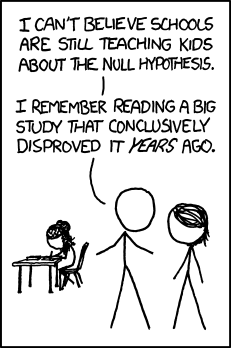
Don’t confuse improbability with impossibility.
Biases in statistics
Selection bias: When the sample is not representative of the population.
Confirmation bias: When we look for evidence that confirms our beliefs.
Publication bias: When only significant results are published.
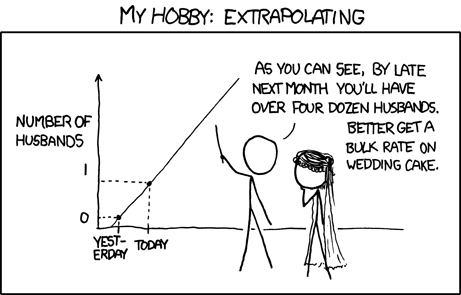
Extrapolation bias: When we extrapolate beyond the data.
Causation bias: When we confuse correlation with causation.
Conclusion
Conclusion
- Ask questions, use PhD consult: https://www.math.aau.dk/research/phd-consult
More questions? eduardo@math.aau.dk

Do and don’ts of statistics in research